EMPOWER STUDENTS WITH DATA LITERACY
Now more than ever, educators need highly-engaging instructional materials that immerse students in authentic problem-solving, drive inquiry, and build data literacy to prepare them for the future. With a library of more than 800 standards-aligned, interactive lessons, Tuva empowers schools and districts across the country to build data literacy—a critical pillar of 21st-century STEM education. Educators and students use Tuva’s statistical tools to explore, visualize, and analyze real-world data for a deeper learning experience.


ENGAGING AND INTERACTIVE
Tuva’s statistical tools empower students to work with raw data, determine how to represent data through graphs and charts, and identify which data are useful. Students love to import their own data from Microsoft Excel or Google Sheets and see it come to life. Using Tuva’s tools, students can engage with their data to explore, visualize, analyze, and further interact with their science and math projects.
BRIDGE CONNECTIONS BETWEEN SCIENCE AND MATH
Teachers can easily implement an interdisciplinary approach to their instruction by incorporating Tuva’s datasets and tools into their lessons and activities. Tuva lessons can be used across all content areas, allowing students to practice and apply important 21st-century skills.
SCIENCE AND MATH INSTRUCTIONAL LESSONS FOR GRADES 3-12
| Grade Level | Science | Math |
|---|---|---|
| Grades 3-5 | over 75 | over 25 |
| Grades 6-8 | over 300 | over 150 |
| Grades 9-12 | over 325 | over 125 |
*Tuva consistently adds lessons to its content library.
ENABLE RIGOROUS, NGSS-ALIGNED SCIENCE INSTRUCTION
With Tuva, educators use inquiry-based lessons, research-based data, and graphing tools to implement the three dimensions of the NGSS, helping students build the scientific literacy needed to identify patterns, relationships, trends, and anomalies.
Authentic, Real-World Learning
Teachers can choose from over 800 authentic lessons and tasks to implement real-world learning in their science instruction.
Student-driven Inquiry
Students have opportunities to develop evidence-based models, form explanations, obtain and communicate information, and engage in argumentation.
Science and Math Connections
Build student proficiency in all the SEPs, with special emphasis on Analyzing and Interpreting Data and the Mathematical & Computational Thinking practices.
CONTEXTUAL DESCRIPTION
HOW TALL WERE THE DINOSAURS?

Learning Objectives
In this activity, students explore the heights of dinosaurs using bar charts. These charts use value bars, that is, the height of the bar represents the height of a dinosaur.
Students will be able to:
- Graph dinosaur heights using bar charts
- Order the bars by increasing height
- Find the tallest and shortest dinosaurs in this group
- Classify the heights by diet
- Identify heights of the tallest and shortest dinosaurs in a given category
CONTEXTUAL DESCRIPTION
DO YOU KNOW YOUR NEAREST STARS?
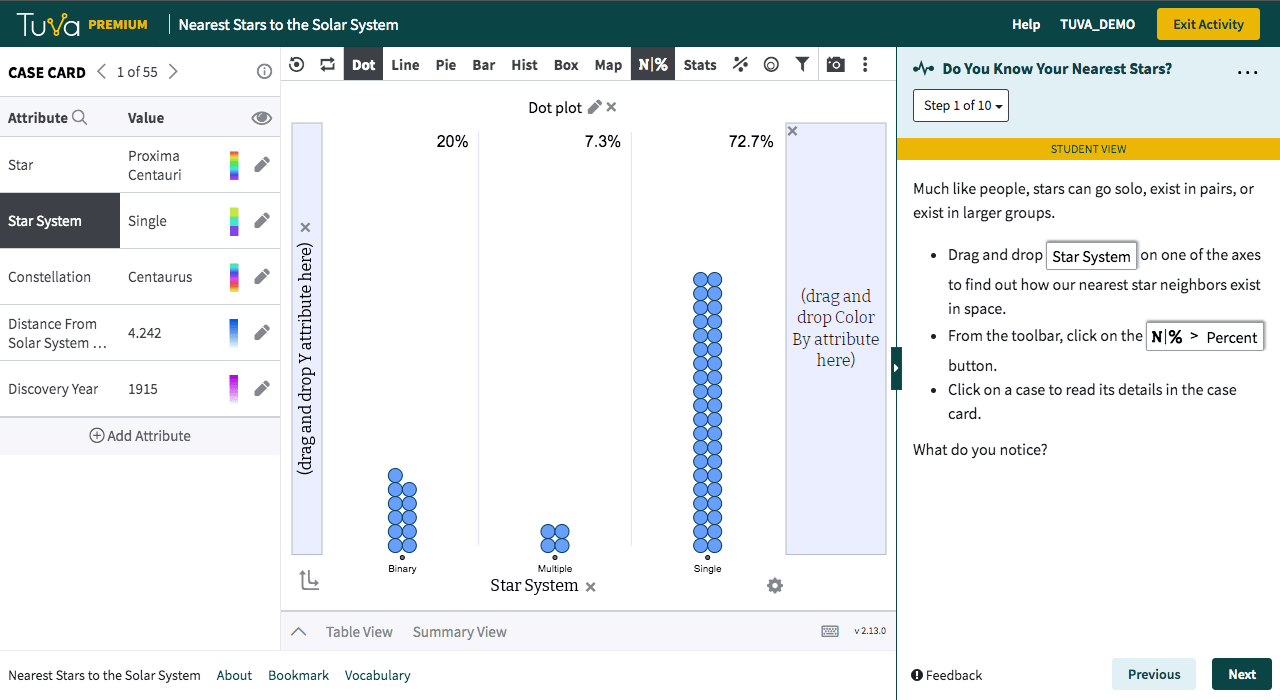
Learning Objectives
Students visualize data on 55 stars nearest to our solar system. They classify the stars on the basis of star system type and identify the nearest star. They investigate attributes such as discovery year and constellation independently and write a brief summary of their findings.
Students will be able to:
- Classify stars on the basis of star system type
- Use dot plots to identify some of the closest stars to the solar system
- Explore attributes such as constellation and discovery year by creating a variety of charts
- Write a brief summary of their findings
CONTEXTUAL DESCRIPTION
IS MAGNITUDE OF AN EARTHQUAKE RELATED TO ITS DEPTH?
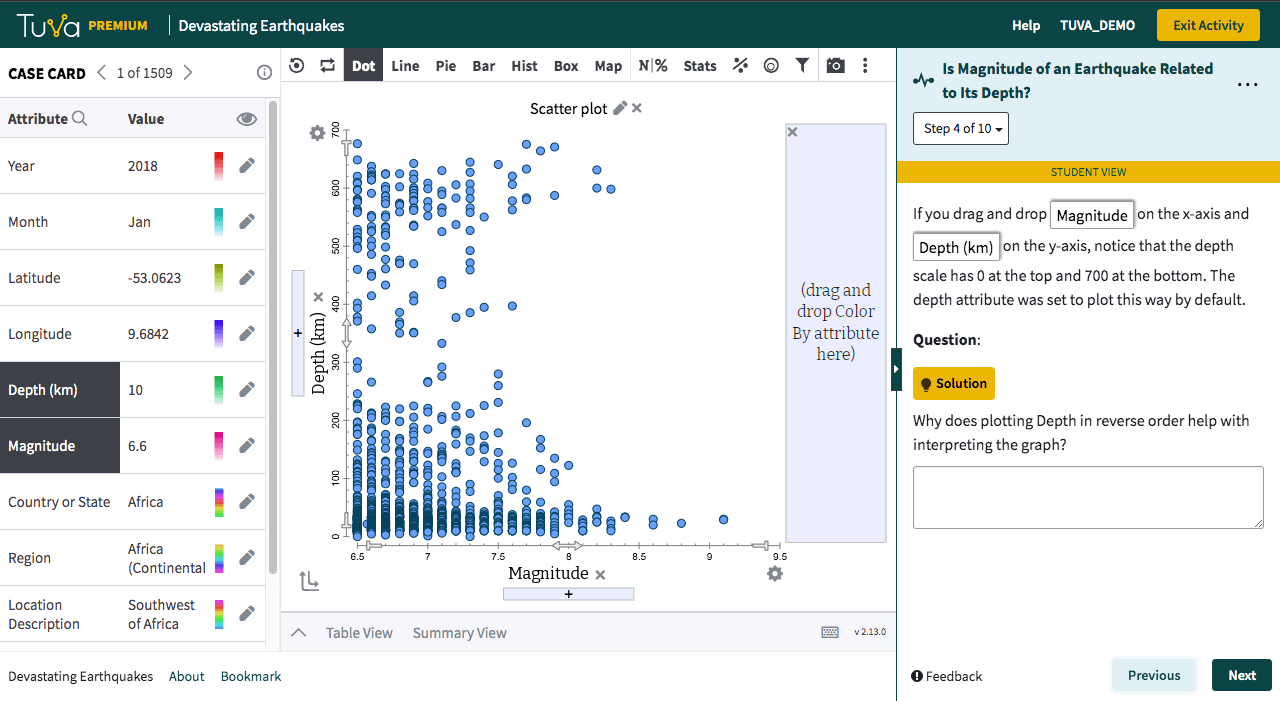
Learning Objectives
Students decide how best to plot the data to answer the given question. They plot the data, describe the results, and make a claim in response to the question. They explain what aspects of the graph support their claim.
As an optional extension, students can add a region or country legend to their graph and highlight different regions to see where earthquakes tend to be deep, shallow, or a mix.
Students will:
- Decide how to graph data to see if there is a relationship between earthquake magnitude and depth (and make their graph)
- Describe their resulting graph (qualitatively and quantitatively)
- Interpret their graph by writing a claim in answer to the question
- Explain what aspects of the graph support their claim
- Optional Extension: Add a region legend to the graph and highlight different regions one at a time to compare the depths and magnitude relationship among regions
— Elementary School – How Tall were the Dinosaurs?
— Middle School – Do You Know Your Nearest Stars?
— High School – Is Magnitude of an Earthquake Related to Its Depth?
DEVELOP STUDENTS’ CONCEPTUAL UNDERSTANDING OF MATH CONCEPTS
Tuva’s research-based data, graphing, and statistical tools allow students to build conceptual understanding of difficult yet important mathematical and statistical concepts.
Students Learn by Doing
By solving problems in authentic, real-world contexts, students gain a strong understanding of foundational mathematics and statistics concepts.
Connecting Concepts and Contexts
Educators can incorporate various mathematical representations and problem-solving strategies, helping students establish connections between the contexts and the concepts they are learning.
Mathematical Concepts and Inquiry
Students engage in mathematical practices of reasoning quantitatively and abstractly, constructing arguments, creating mathematical models, and strategically using data, graphing, and statistical tools.
CONTEXTUAL DESCRIPTION
HOW FAST ARE OCEAN ANIMALS?
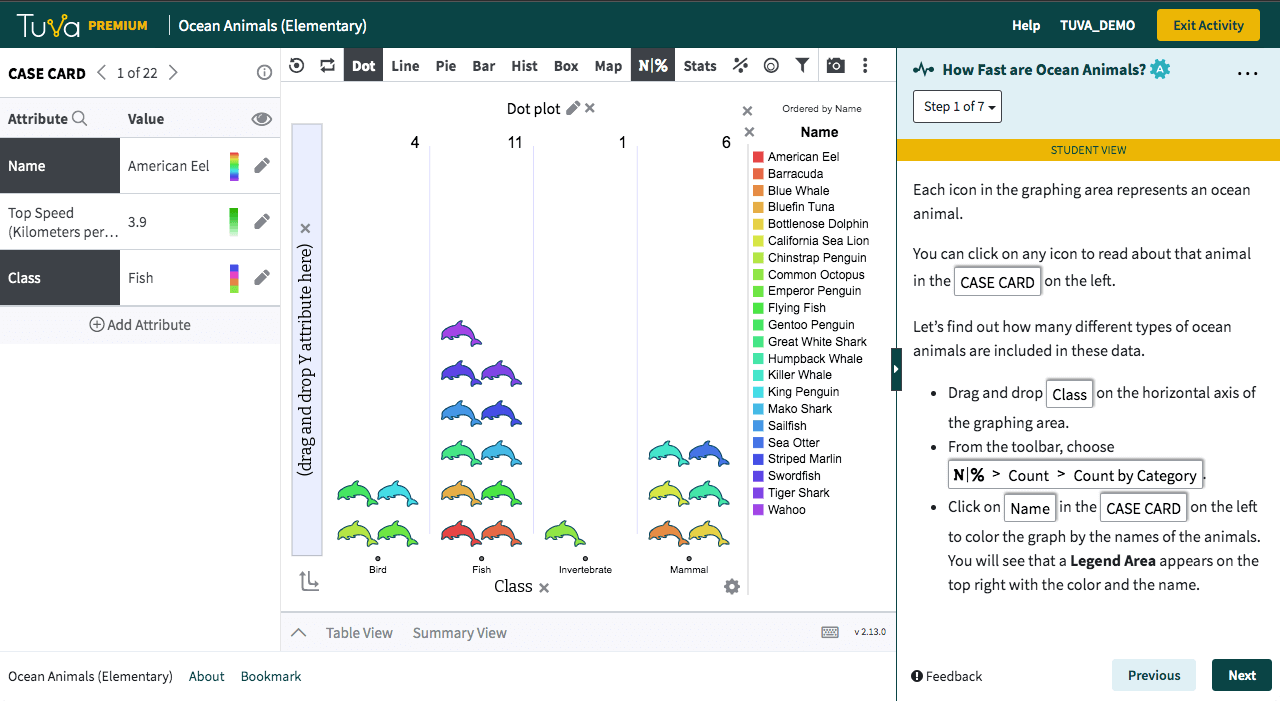
Learning Objectives
In this activity, students explore data on ocean animals to identify the fastest and slowest animals. They also classify the animals by class.
Students will be able to:
- Graph the speed of different ocean animals using picture dot plots
- Classify the animals using pictographs
- Find the fastest and slowest animals by class
CONTEXTUAL DESCRIPTION
WHAT IS THE RELATIONSHIP OF BIKE WEIGHTS AND JUMP HEIGHTS?
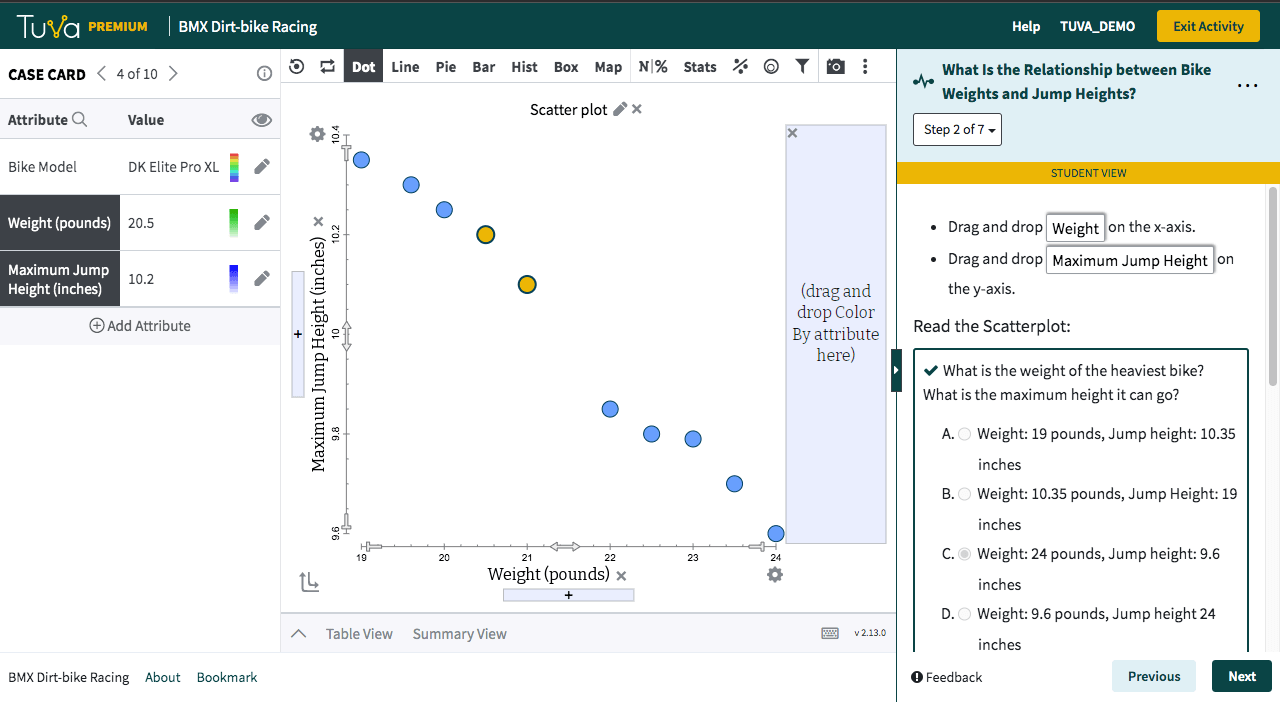
Learning Objectives
Students investigate the relationship between bike weights and jump heights by creating a scatter plot. They use the Tuva movable line to model the relationship and describe it in terms of form, direction, and strength.
Students will be able to:
- Graph the relationship between bike weights and jump heights using scatterplots
- Fit the data using the Tuva movable line
- Describe the relationship in terms of form, direction, and strength
- Interpret the form, direction, and strength in context
CONTEXTUAL DESCRIPTION
SLINKIES HAVE A FUNCTION
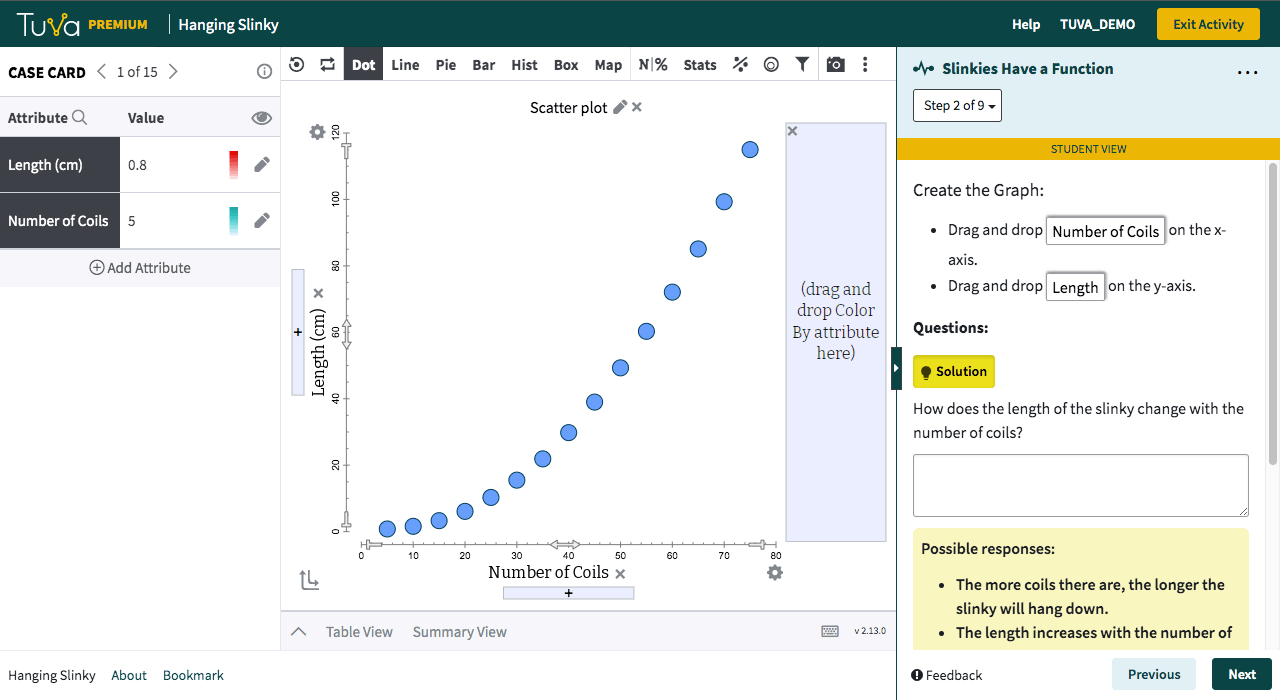
Learning Objectives
In this activity, students investigate how the length of a vertically hanging slinky depends on the number of coils. They fit the data and find the function that describes the relationship.
Students will be able to:
- Graph data on number of coils and length of a hanging slinky using scatterplots
- Fit the data using a slider parameter
- Describe the behavior of the fitted function by manipulating the parameter
- Apply the model to make predictions
— Elementary School – How fast are ocean animals?
— Middle School – What Is the Relationship between Bike Weights and Jump Heights?
— High School – Slinkies have a function
